


Fragmentation decides how much secondary breaking a shot needs, how fast the excavator digs, how full each truck runs, and how hard the primary crusher works. Yet it is often judged by eye, photographed now and then, and rarely recorded in a form that can be compared from one blast to the next.
What fragmentation means in numbers
Fragmentation is a size distribution: the share of the blasted rock below each size, usually drawn as a cumulative curve. These numbers from that curve matter most.
- X50, the median size. Half the rock by mass is smaller than this. It is the single figure most blast models predict.
- X80, and the top size. X80 is the size that 80% of the rock passes. The top size is the size of the largest fragments. Together they show what the excavator, the crusher gape and the grizzly have to handle. Too much rock above the crusher’s limit means secondary breaking or blockages.
- The fines fraction. The share of rock below a set small size, often a few millimetres in aggregates. On many sites fines sell for less, or not at all, so too many fines lower the value of the blast.
A blast that hits a good X50 can still be a poor blast if its top size is too large or its fines too high. The median alone would miss that, so it is worth measuring the full distribution.
Common ways quarries measure fragmentation
1. A visual estimate. The shotfirer or quarry manager looks at the blast pile (the muckpile) and judges it. It is fast and free, but no two people judge a pile the same way, and nobody can compare it over time.
2. Sieving. Screening a sample of the pile gives the true distribution of that sample, including fines. It is accurate. At blast-pile scale it is also slow and expensive, so it is done rarely, mainly to check or calibrate other methods.
3. Photographs of the pile. Someone photographs the pile with a scale object in shot. Each rock is then outlined in software, either by hand or semi-automatically. This gives a real distribution, but from a handful of images of one part of one face.
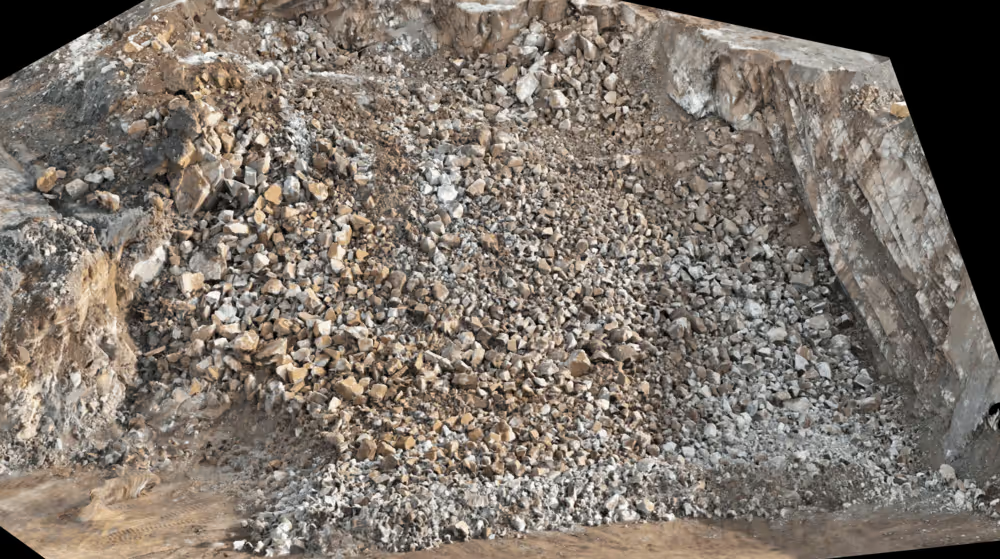
4. Drone surveys or cameras at the crusher, with automatic segmentation. A drone photographs the whole pile, or fixed cameras photograph each truck as it tips at the primary crusher. A segmentation model then outlines and measures most of the visible rocks. The smallest rock it can measure depends on the image resolution, and is usually a few pixels across. Because the software measures automatically, every blast can be measured the same way, whether the images come from a drone, a camera on the shovel or a camera over each truck. Readings at the crusher only belong to a blast if each load is traced back to it. A camera on the belt after the primary crusher measures crushed rock, not the blast.
Where image methods fall short
Every image-based method sees the surface, not the inside of the pile. The rock on the surface is not always typical of what is underneath. Fines also tend to hide between larger fragments, so image methods usually undercount them. Overlapping rocks, dust, shadow and wet surfaces all make outlines harder to draw.
Two habits reduce these errors. The first is measuring in more than one place: the pile from the air, then the same rock truck by truck as it is tipped at the primary crusher. The trucks carry rock from all through the pile, so they show what the surface hides. Crusher feed rate and power give a further check. The second habit is consistency. A method with a known bias, used the same way on every blast, is far more useful for improving the next pattern than an accurate method used twice a year.
Using each result to plan the next blast
A size distribution says how the last blast went. To improve the next one, it has to be linked to what caused it: the pattern, the charge and the ground.
The traditional way to do that is an empirical model, a formula fitted to results from many blasts. The best known is Kuz-Ram. Its name joins two older pieces of work: an equation from the Soviet mining scientist Kuznetsov, published in 1973, which links the energy of the explosive to the size of the broken rock, and the Rosin-Rammler curve, a standard way to describe a spread of sizes. Claude Cunningham, a South African explosives engineer, combined the two in 1983. The model predicts the median fragment size from the powder factor, the explosive’s strength, the charge per hole and a rock factor. It then uses the pattern’s geometry to estimate the full size distribution, as a Rosin-Rammler curve. It is a useful starting point, but it has limits. It tends to underpredict fines. Its rock factor is built from the rock mass, including joint spacing and orientation. In practice it is usually set once for a site, so it does not follow changes in jointing from one face to the next. It also has no term for water.
A machine learning model can learn these relationships from past blasts and their results, using the quarry’s own records and wider industry data. It can only follow changes in the ground if those changes are recorded for each blast, and it has to be tested on blasts it has not seen. With a good record of past blasts, it estimates the size distribution a proposed pattern is likely to produce on a given face. An optimiser can then search for the most cost-effective pattern.
What to record from every blast
To build that record, each blast needs its design and its result kept together.
- Design, and the shot as drilled and loaded: burden, spacing, the face profile and front-row burden, hole diameter, depth, angle and measured deviation, subdrill, stemming length and material, explosive type, charge per hole as loaded, maximum instantaneous charge, powder factor and initiation timing.
- Ground: face or bench location, rock type, and any notes on joints, bedding, water or hard bands.
- Result: the measured size distribution. For the rock from that blast: secondary breaking hours, excavator dig rate, load counts, and crusher throughput and power. Ground vibration and air overpressure readings, with where the monitor was. Any misfire or flyrock.
UK quarries that blast must already prepare a written specification for each shotfiring operation. So most of the design record usually exists, though often on paper or in the contractor’s files. The results are usually scattered across the plant, the weighbridge and the shift log. Matching the two up, blast by blast, is often the most useful first step.
An example
New Gradient has built a system like this for Tarmac. The blast fragmentation optimisation page explains how it works and what a quarry needs to start.